Distributed Tracing with Spring Boot Jaeger - Part 2
Hello World! I am a Software Engineer. I am passionate to learn new technologies, and better myself at software craftsmanship. On this blog I share my experiences with you. Let's learn together.
This is a two parts series on this article, where we have covered Distributed Tracing in a Spring Boot application using Jaeger. This is part 2 of the series.
If you are coming to this article directly, I will urge you to go through the part 1 of this series here.
🎯 Integrating Jaeger in our Spring Boot project
Let's head over to pom.xml and add below dependency there.
<dependency>
    <groupId>io.opentracing.contrib</groupId>
    <artifactId>opentracing-spring-jaeger-web-starter</artifactId>
    <version>3.3.1</version>
</dependency>
In this project I have used <version>3.3.1</version>. At the time of writing this article, the current version I checked at official Github repository is mentioned as 3.3.2. But the version 3.3.2 was not available in the maven central repository, that's why I went ahead with version 3.3.1.
Okay, now we need to configure the Jaeger so that spans generated from the application are collected at the backend.
I configured the bare minimum stuff by while exposing the JaegerTracer bean. Below is how I did the configuration for initiator-service application.
@Bean
public JaegerTracer jaegerTracer() {

    return new
        // Give a name to the configuration.
        Configuration("initiator")
        // configure the sampler here.
        .withSampler(new SamplerConfiguration().withType(ConstSampler.TYPE).withParam(1))
        // Report and log spans? Well, yes please do!
        .withReporter(new ReporterConfiguration().withLogSpans(true))
        // Get the Tracer object.
        .getTracer();
}
We can do even more configuration here; like plugging in the MetricsFactory, Tracer tags etc. If you do ctrl+space after . in this builder method, you will be able to see more options popping up that you can use for your configuration.
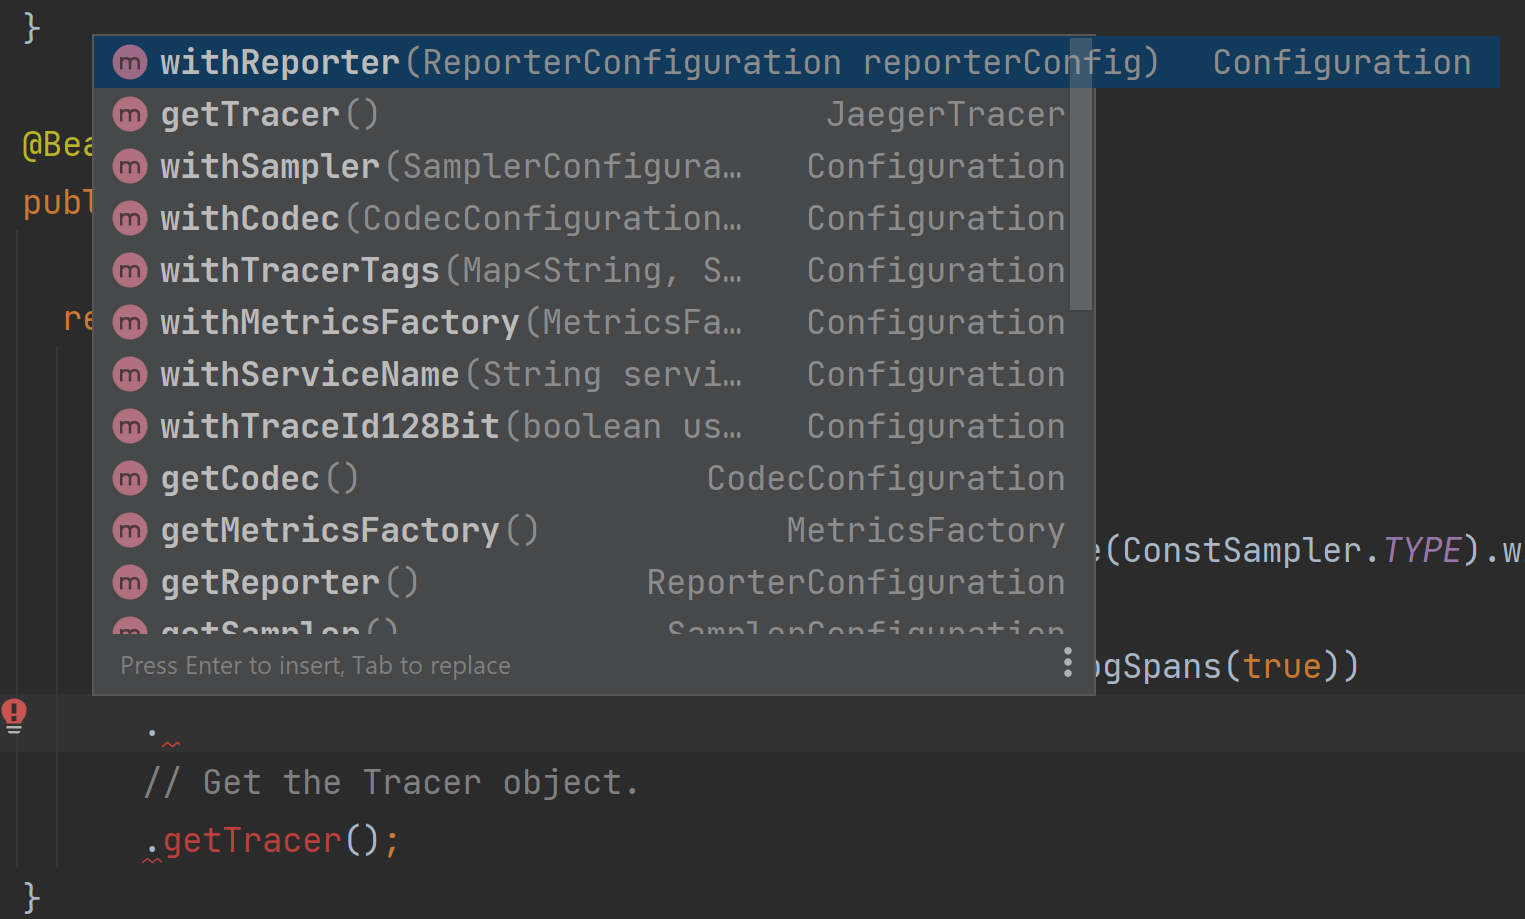
For the simplicity sake, I have kept my configurations bare minimum.
This configuration for JaegerTracer bean needs to be done for orchestrator-service also.
@Bean
public JaegerTracer jaegerTracer() {

    return new Configuration("orchestrator")
        .withSampler(new SamplerConfiguration().withType(ConstSampler.TYPE).withParam(1))
        .withReporter(new ReporterConfiguration().withLogSpans(true))
        .getTracer();
}
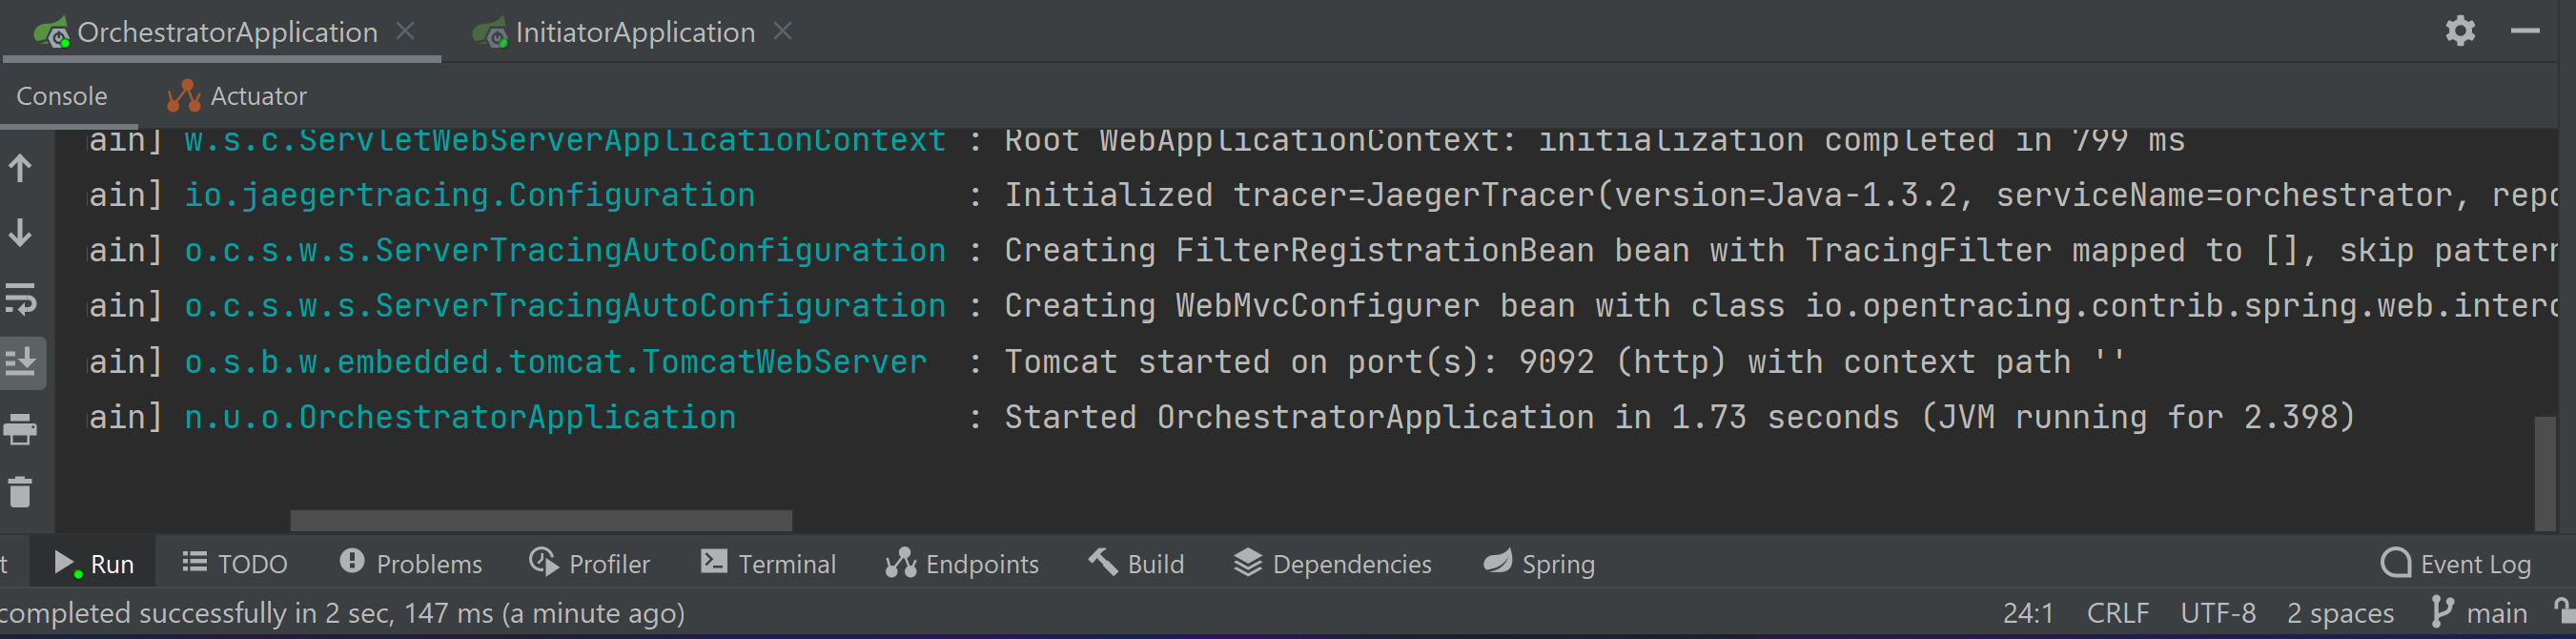
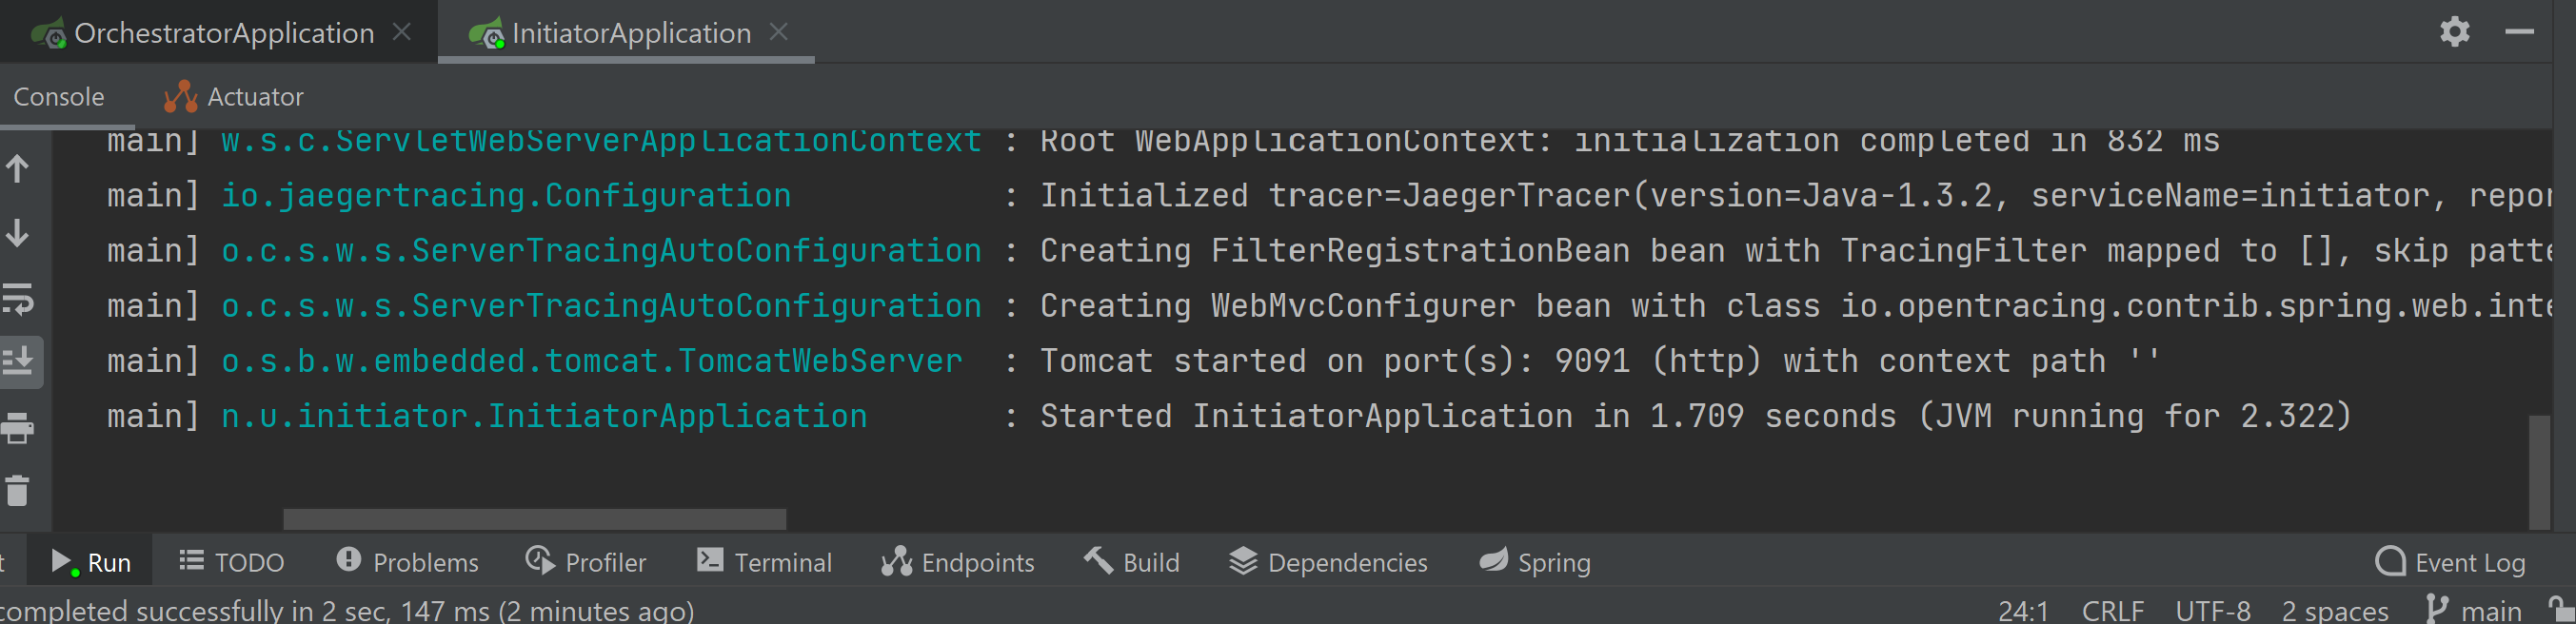
Both our applications are ready to push the data to backend Jaeger UI. Let's start initiator-service and orchestrator-service now.
🎯 Start the Jaeger UI
Jaeger UI sits in the backend and stores all the tracing information sent by all the applications that have Jaeger clients present in them. Jaeger UI uses the data sailed from all these clients and present visualizations for us.
I will be running Jaeger UI in a docker container.
Pull the latest image from docker. At the time of writing this article it was 1.34.
docker pull jaegertracing/all-in-one:1.34
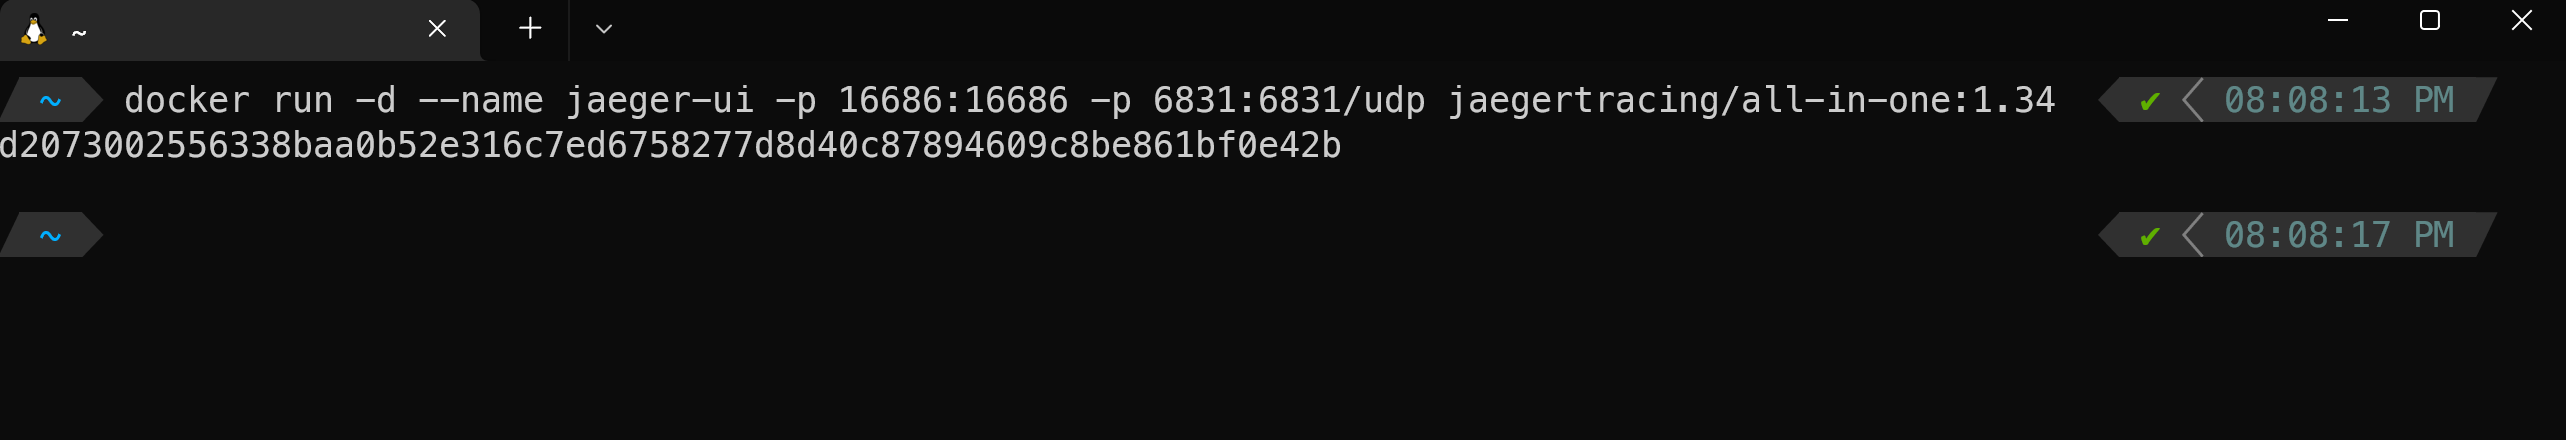
Start the Jaeger UI in docker container using the below command:
docker run -d --name jaeger-ui -p 16686:16686 -p 6831:6831/udp jaegertracing/all-in-one:1.34
At the default port 16686 we will be able access the Jaeger UI from browser for visualization. 6831 is the default udp port where both our applications will be pushing the tracing data.
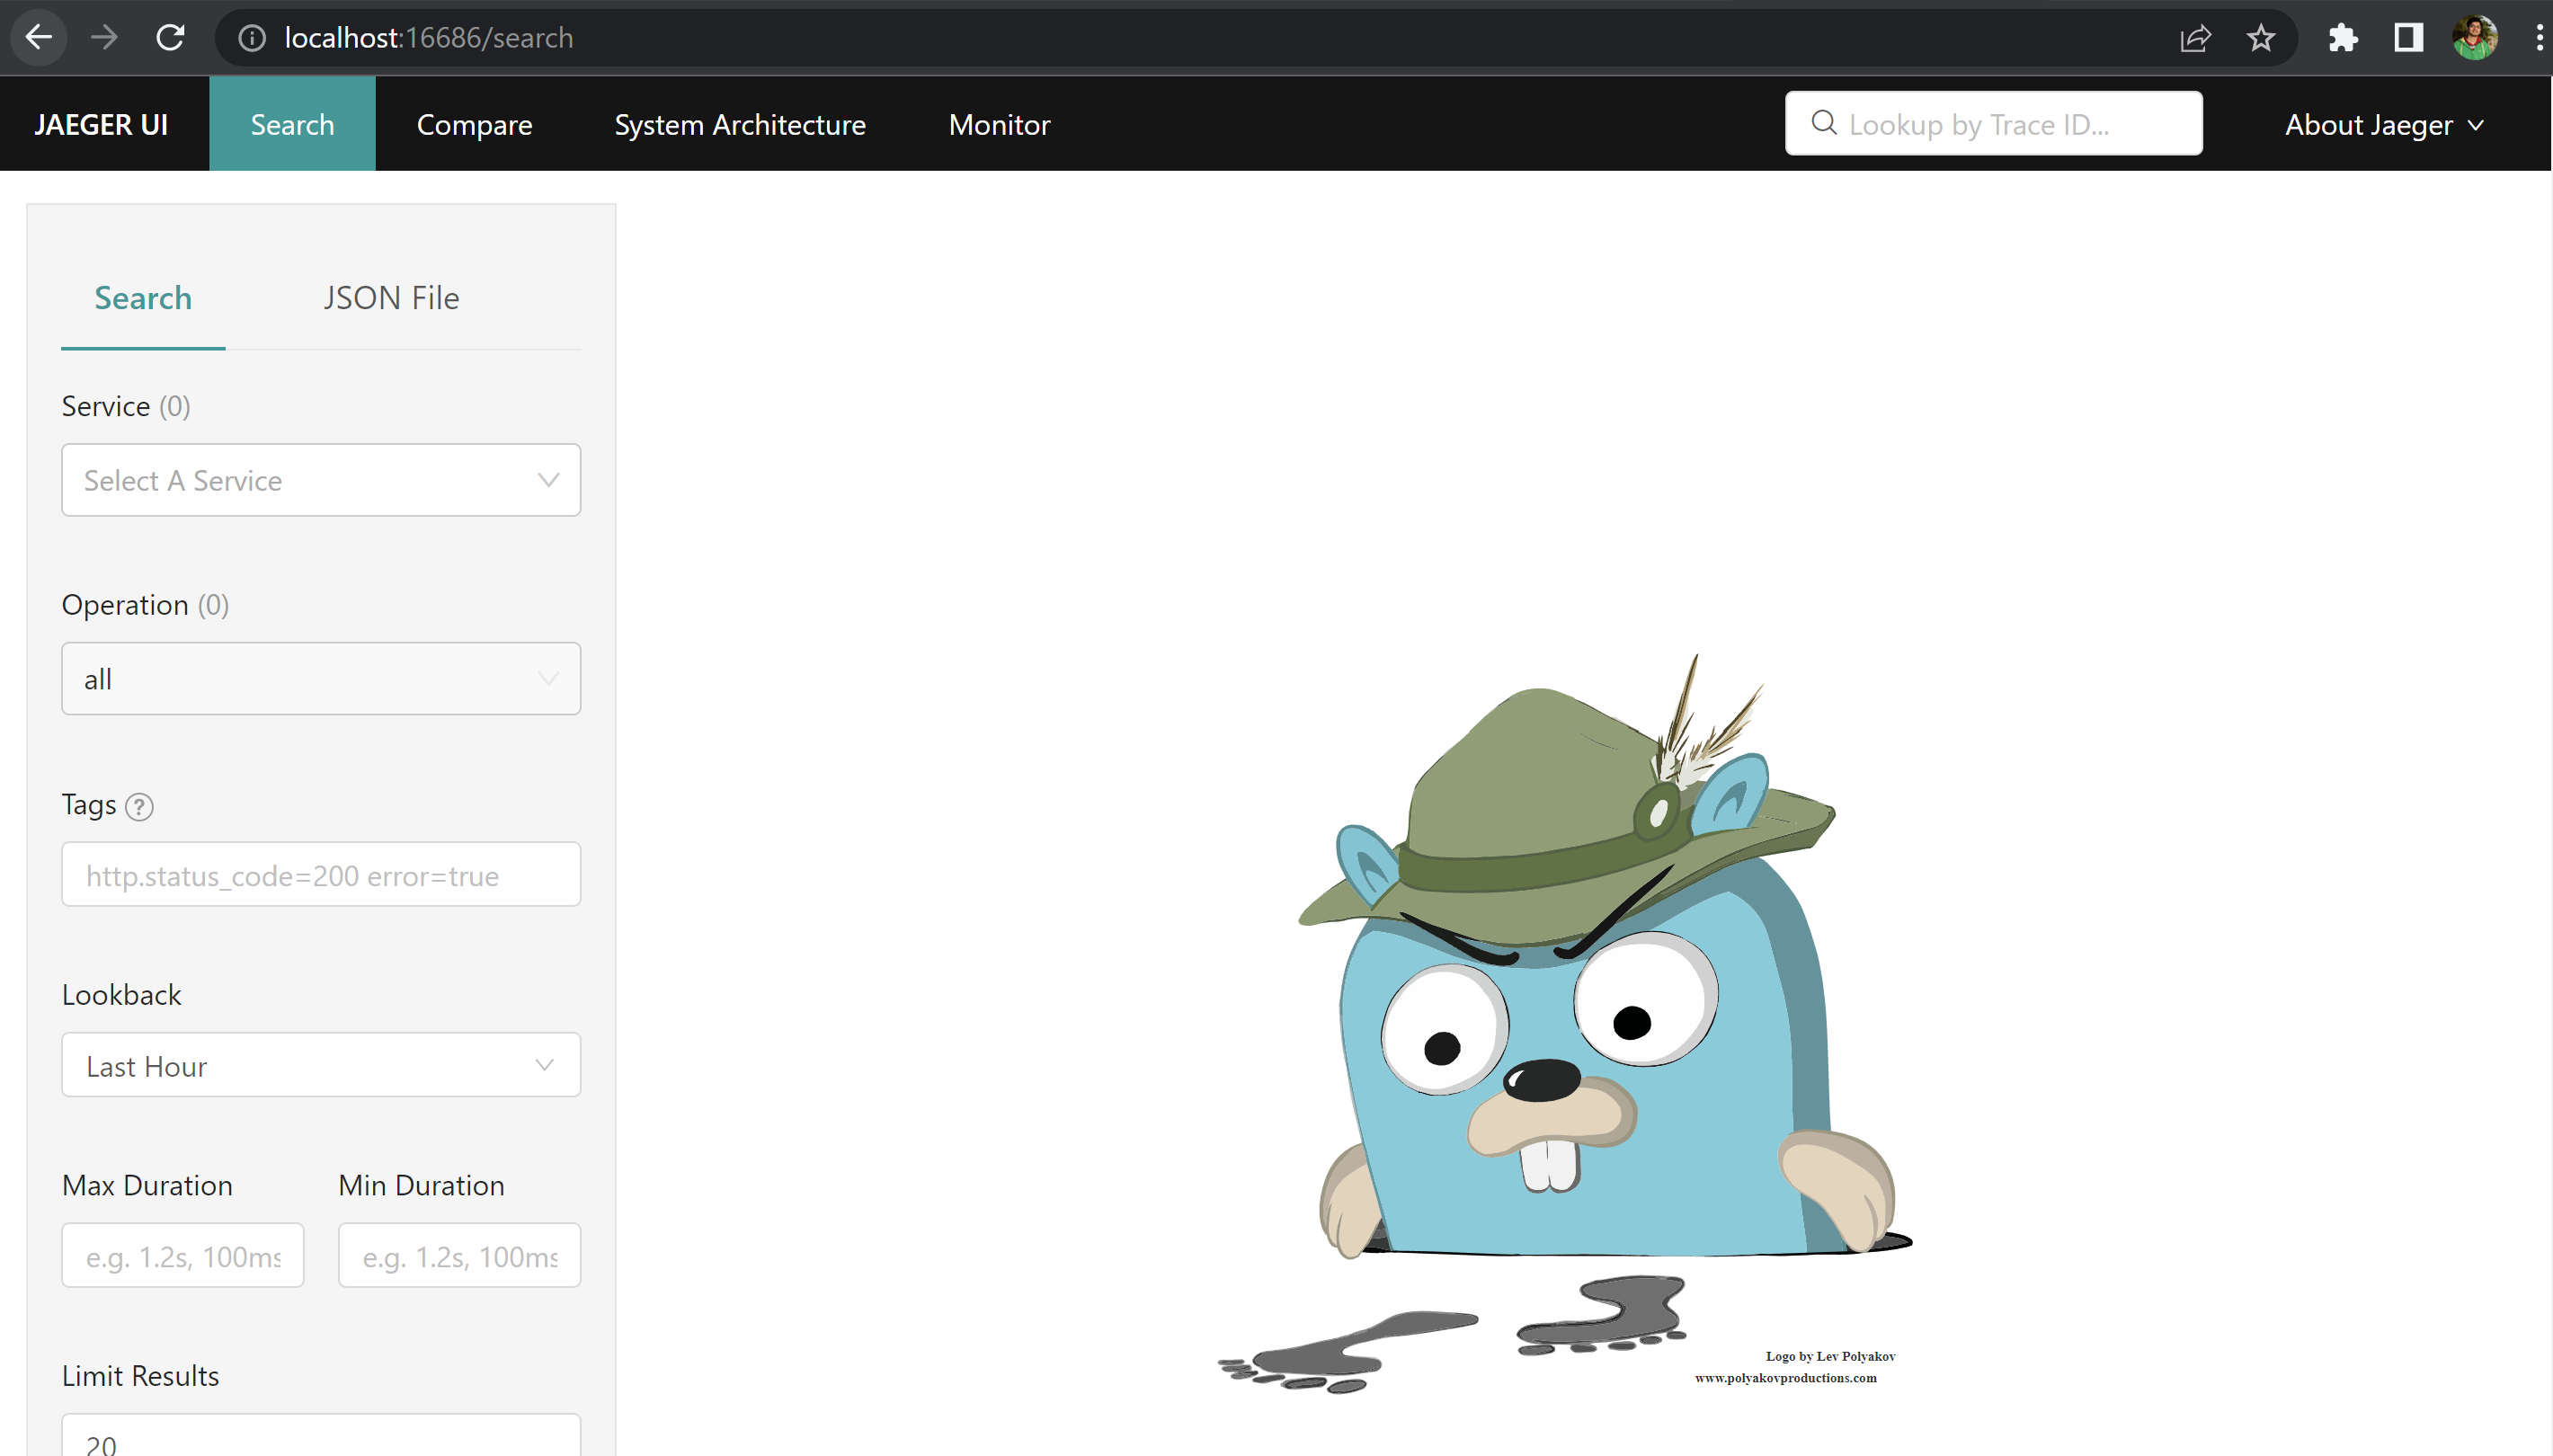
Let's check if Jaeger UI is loading in the browser or not.
http://localhost:16686/
🎯 Analyze the distributed tracing
Let's hit the initiator-service and try to see the response.
http://localhost:9091/v1/api/initiator/data/13
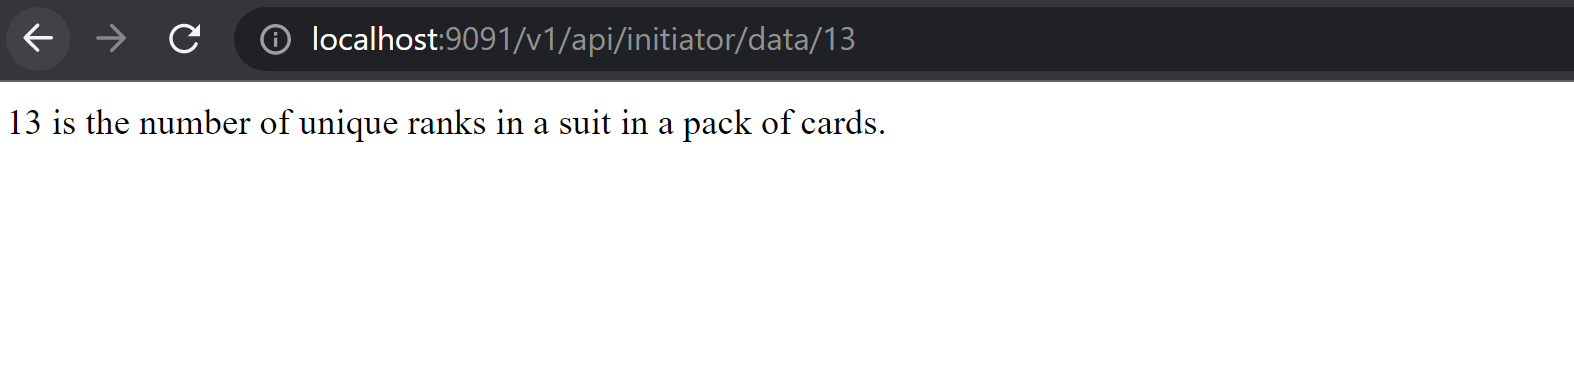
The initiator-service called orchestrator-service, which in turn called the Numbers API. The orchestrator-service received response from Numbers API and responded back to initiator-service.
If we hit the Jaeger UI again, we should be able to see our services listed there.
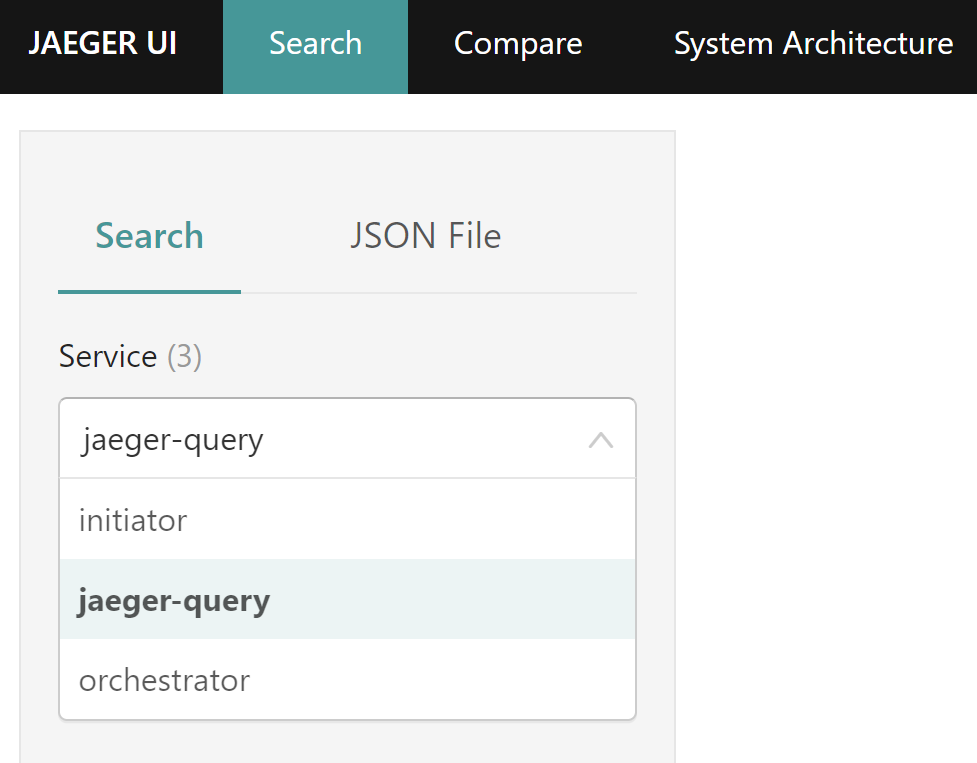
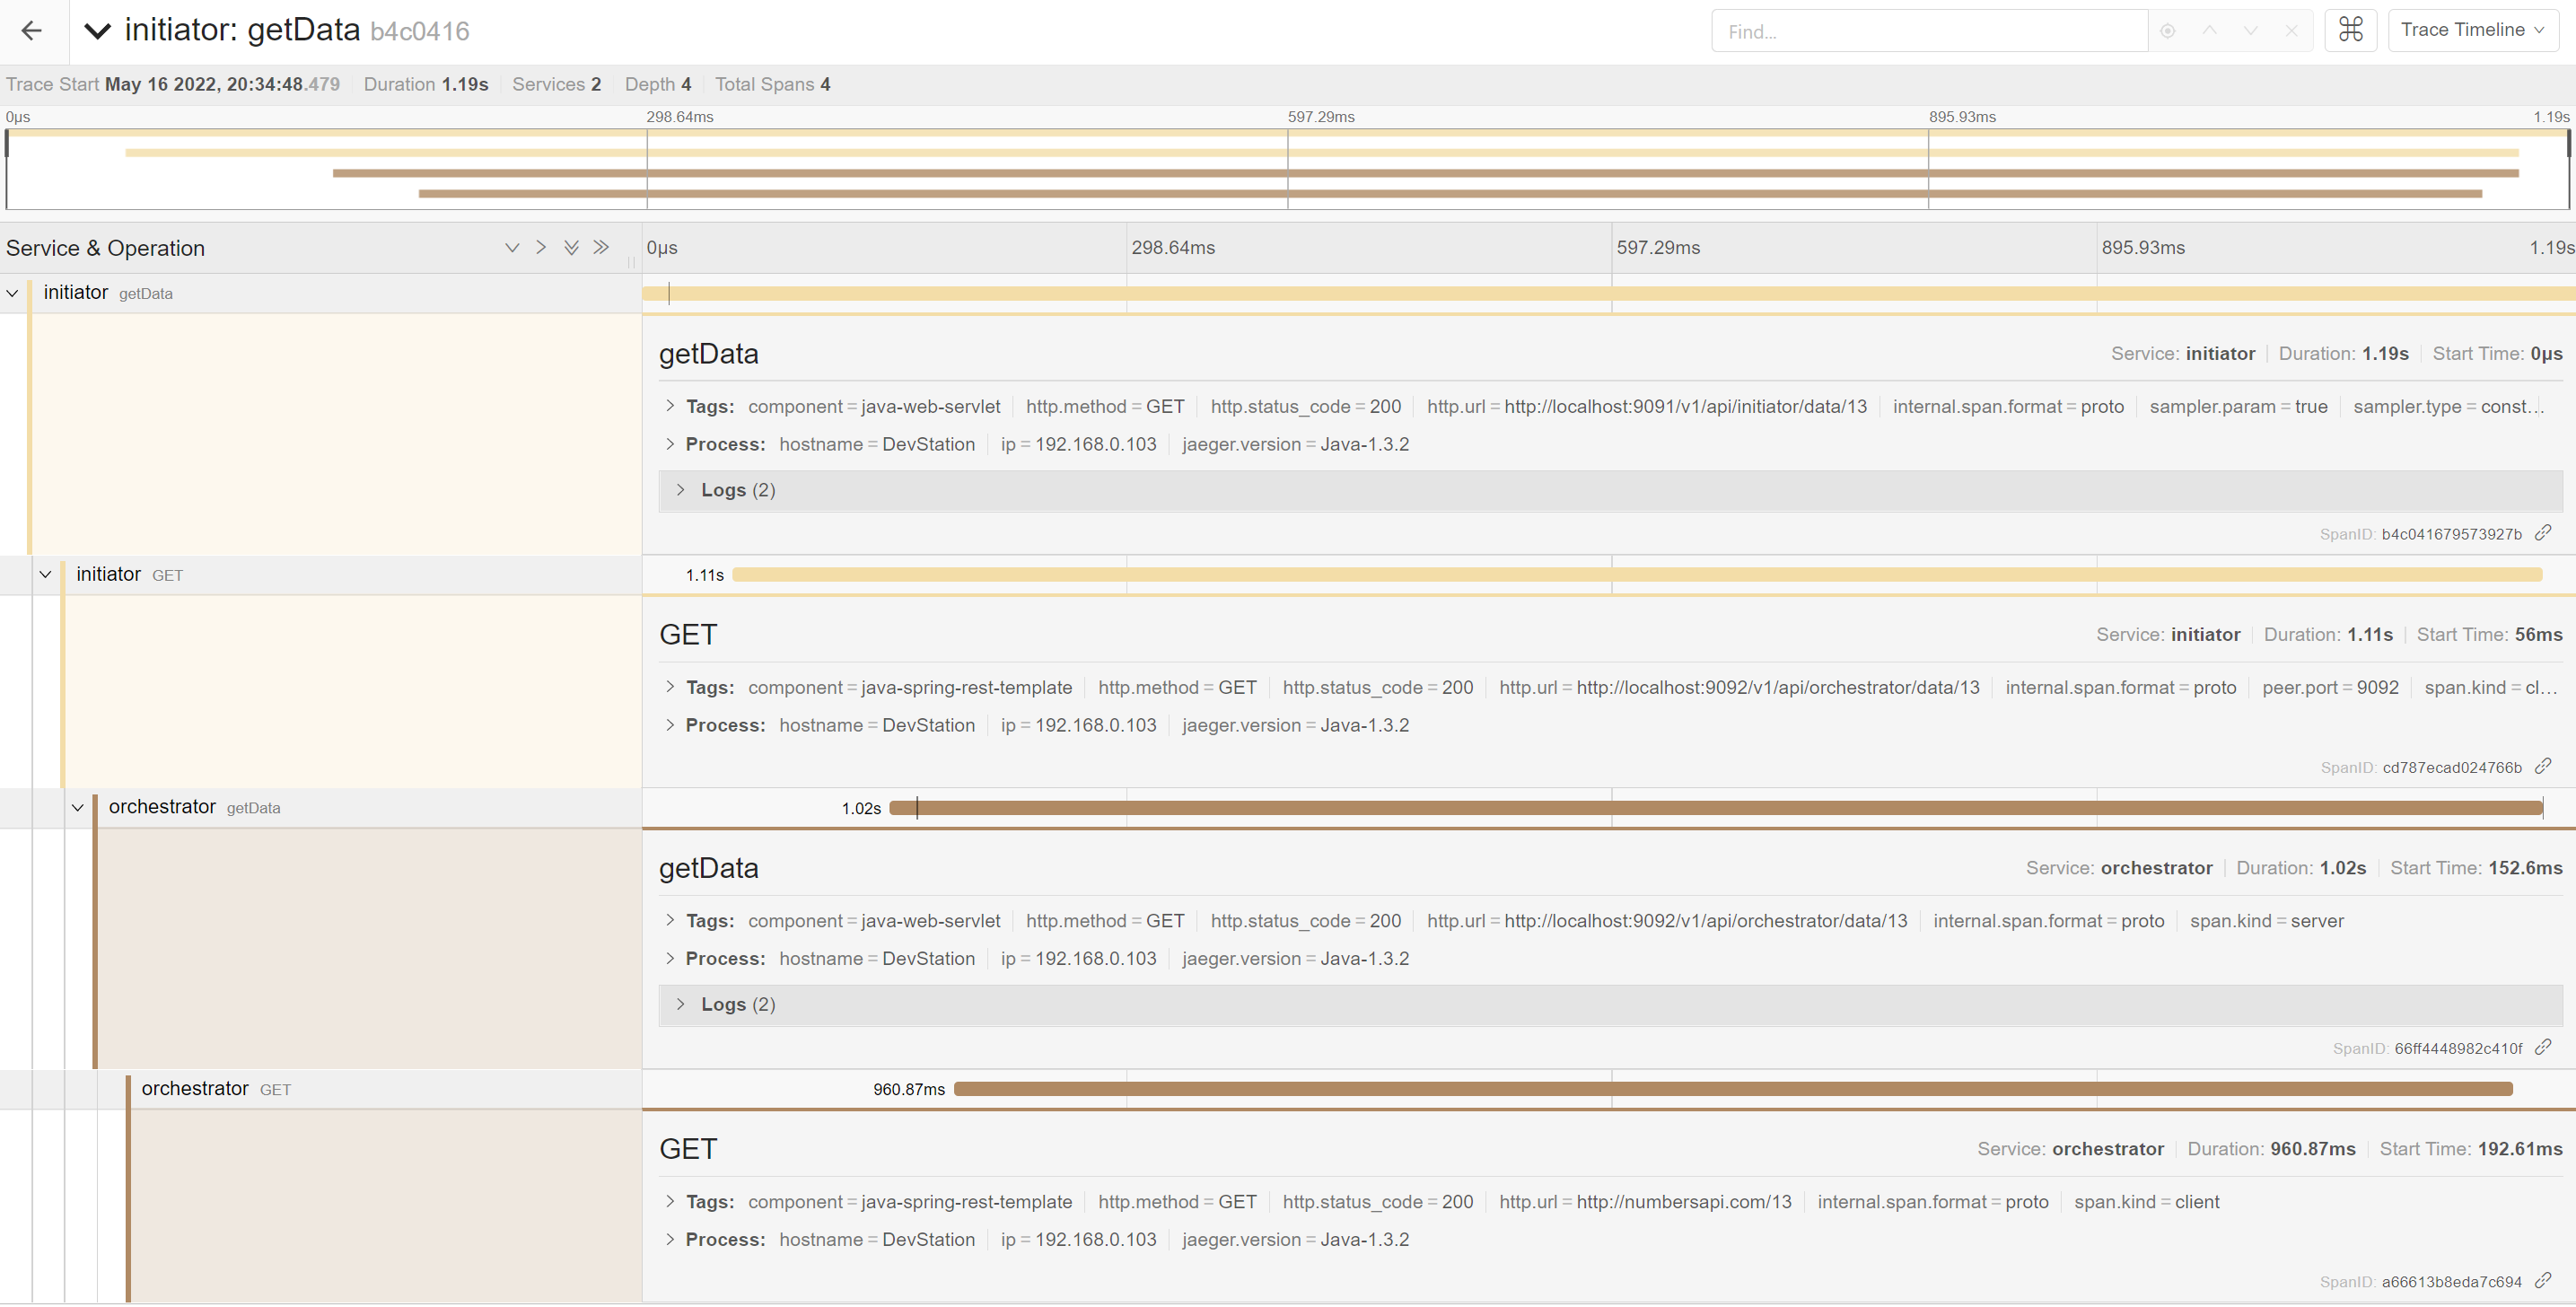
Let's try to see traces under initiator service.
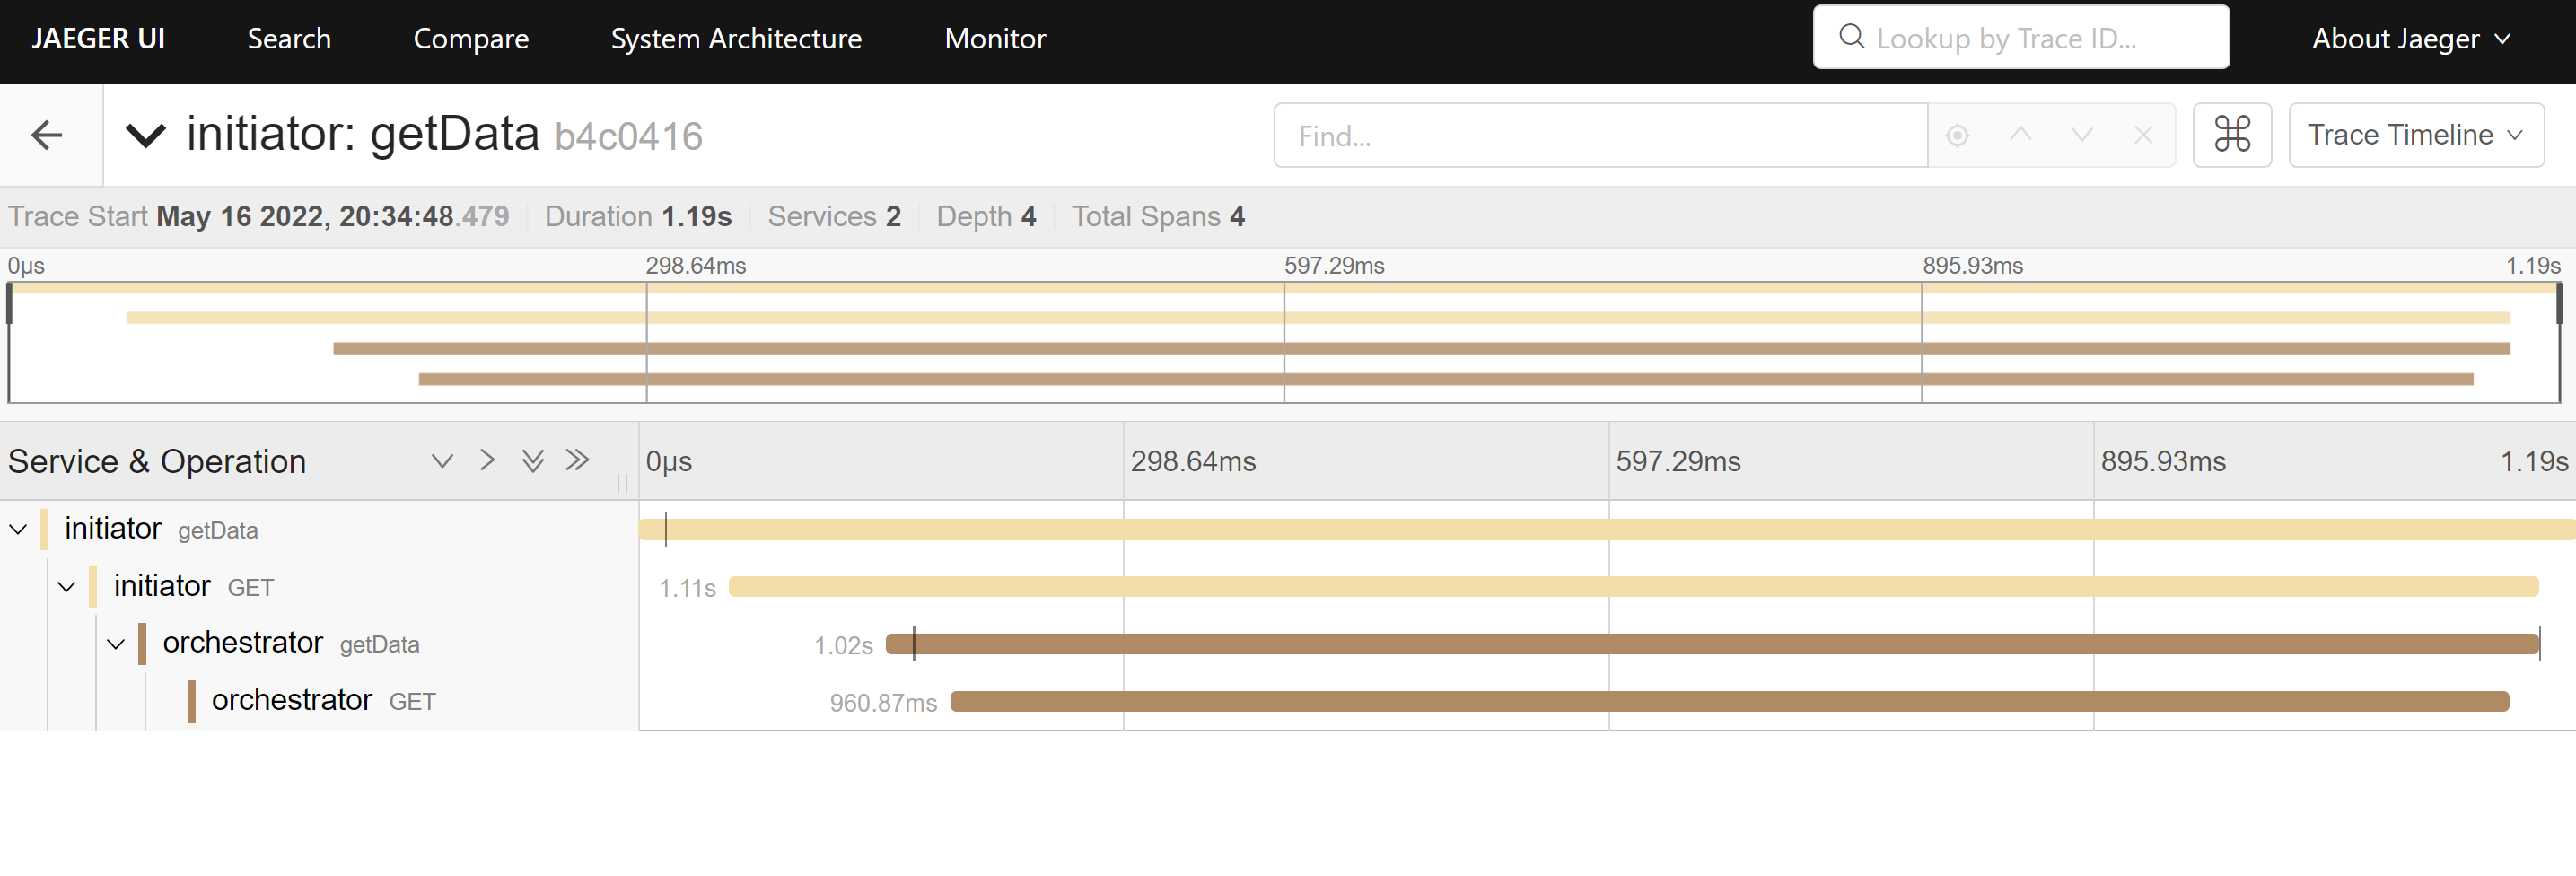 You can see that we have information available to us at each juncture, along with the time taken, in the application flow from
 initiator-service to orchestrator-service.
But wait. Before we analyze this visualization more, let's get back to console logs of our applications.
🎯 Console logs for initiator-service
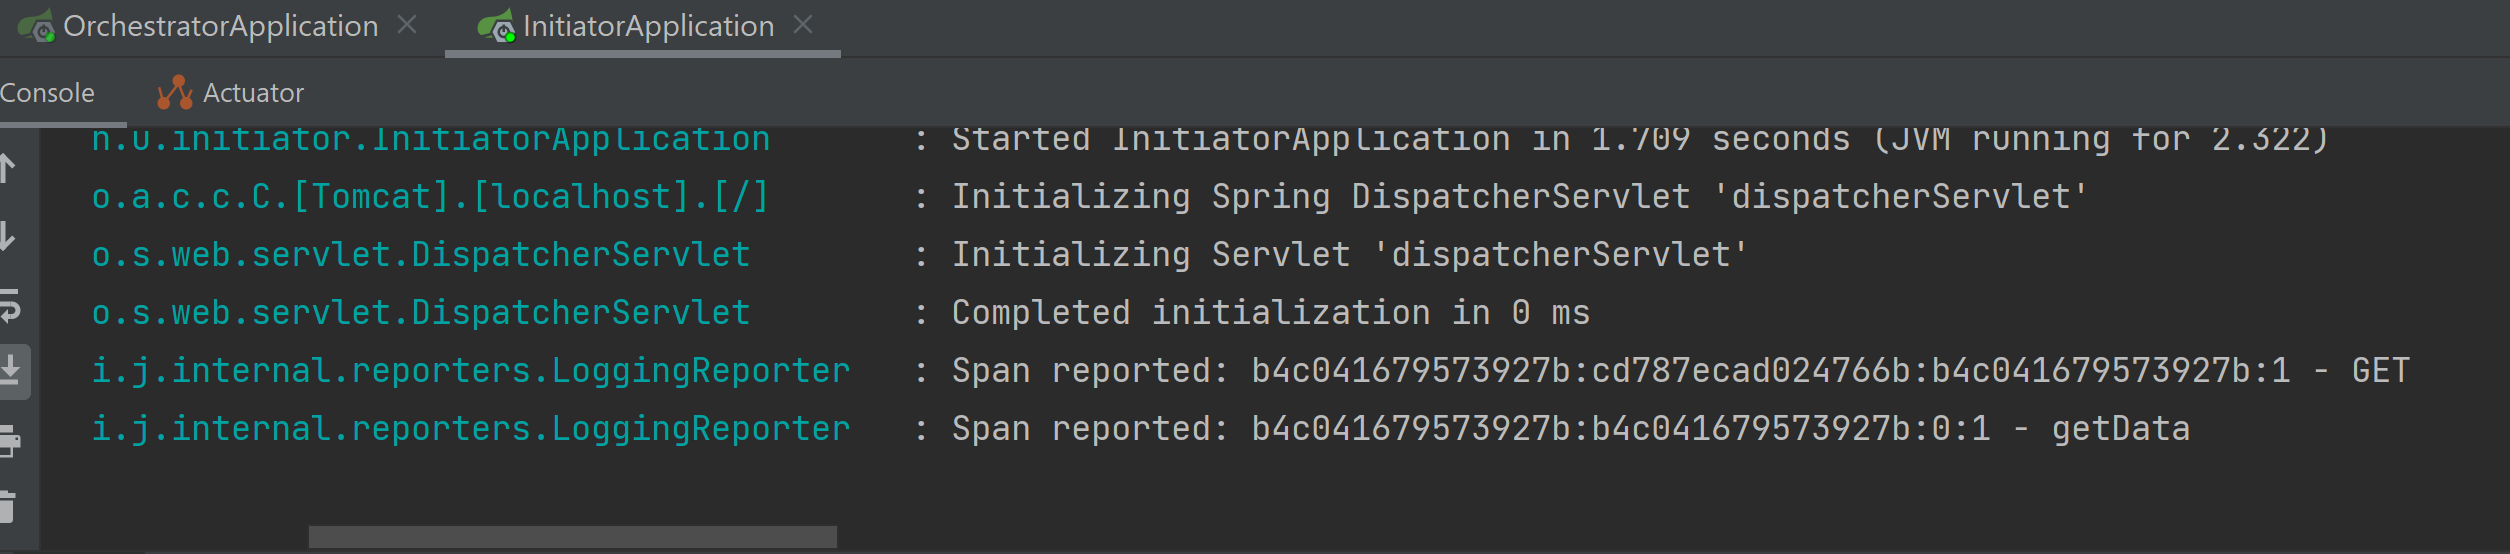 Here we have some valuable information.
 Span reported: b4c041679573927b:cd787ecad024766b:b4c041679573927b:1 - GET.
b4c041679573927bis root span id.cd787ecad024766bis current span id.b4c041679573927bis parent span id.
The root and parent span id is same for initiator-service. Why so? This is so because from here only our communication started. As soon as we hit the initiator-service root span id was created. This happens to be parent span id as well because there was no preceding service call before this. If we see similar logs in orchestrator-service we will have root and parent span id different.
🎯 Console logs for orchestrator-service
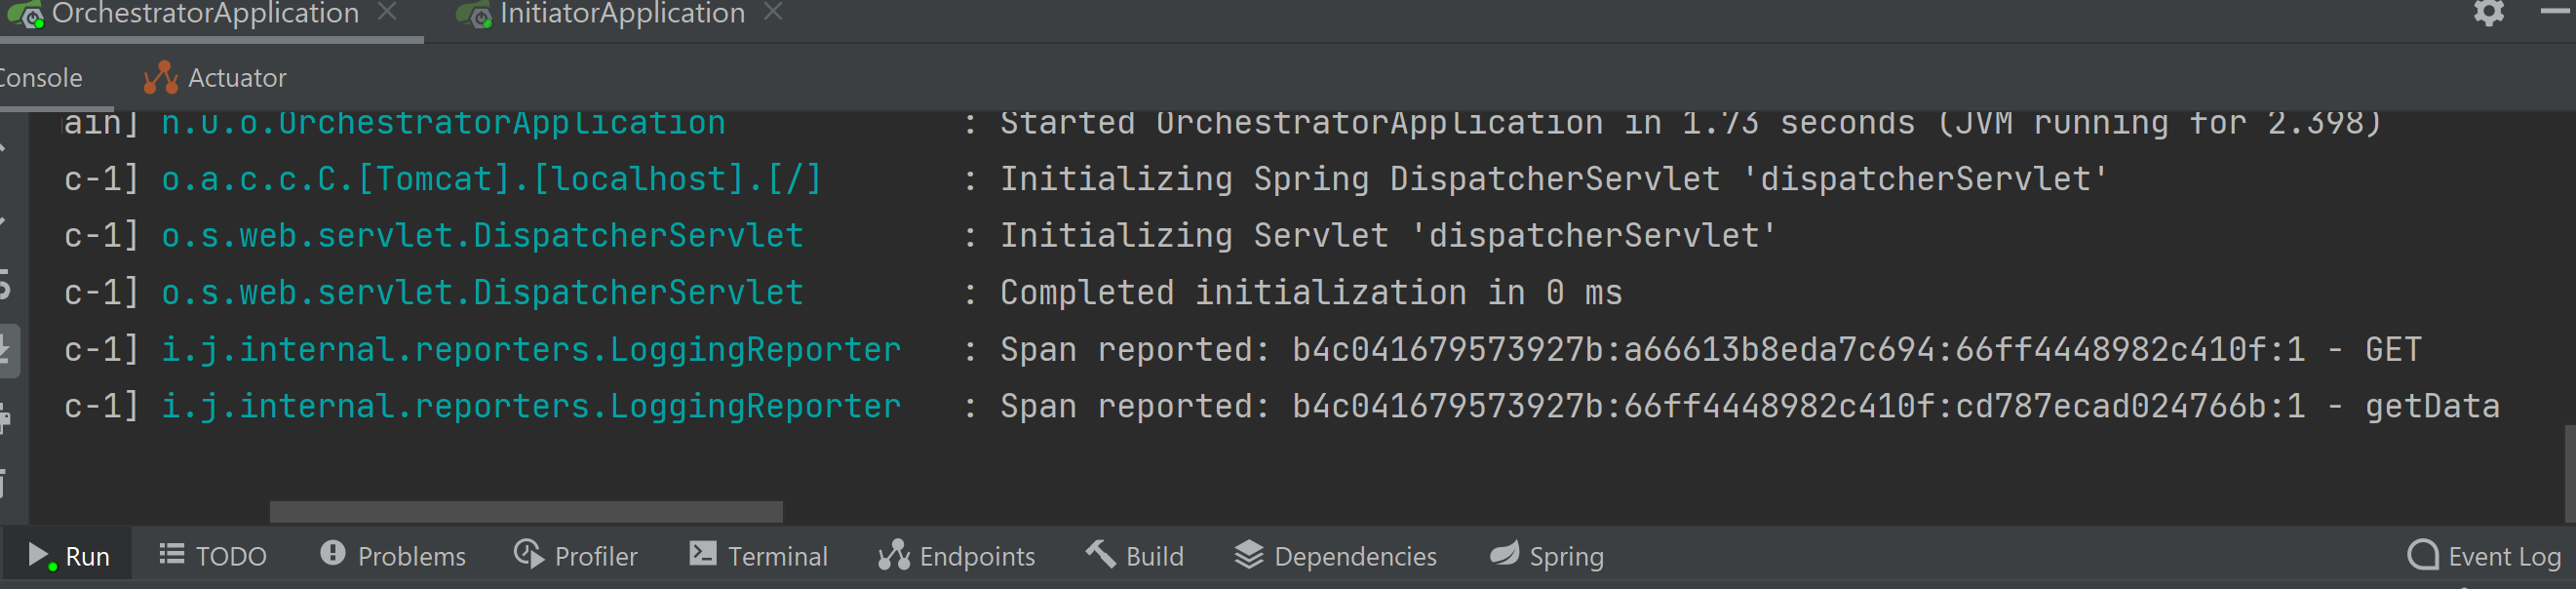
b4c041679573927bis the root span id. This is same as root span id ininitiator-service. It is uniquely identifying the transaction through these two services.66ff4448982c410fis the current span id. This one is unique.cd787ecad024766bis the parent span id. This is the current span id frominitiator-service. Why so? This is so becauseinitiator-serviceis the parent service which called theorchestrator-service.
Now is a good time to go back to Jaeger UI and understand the same relationship there.
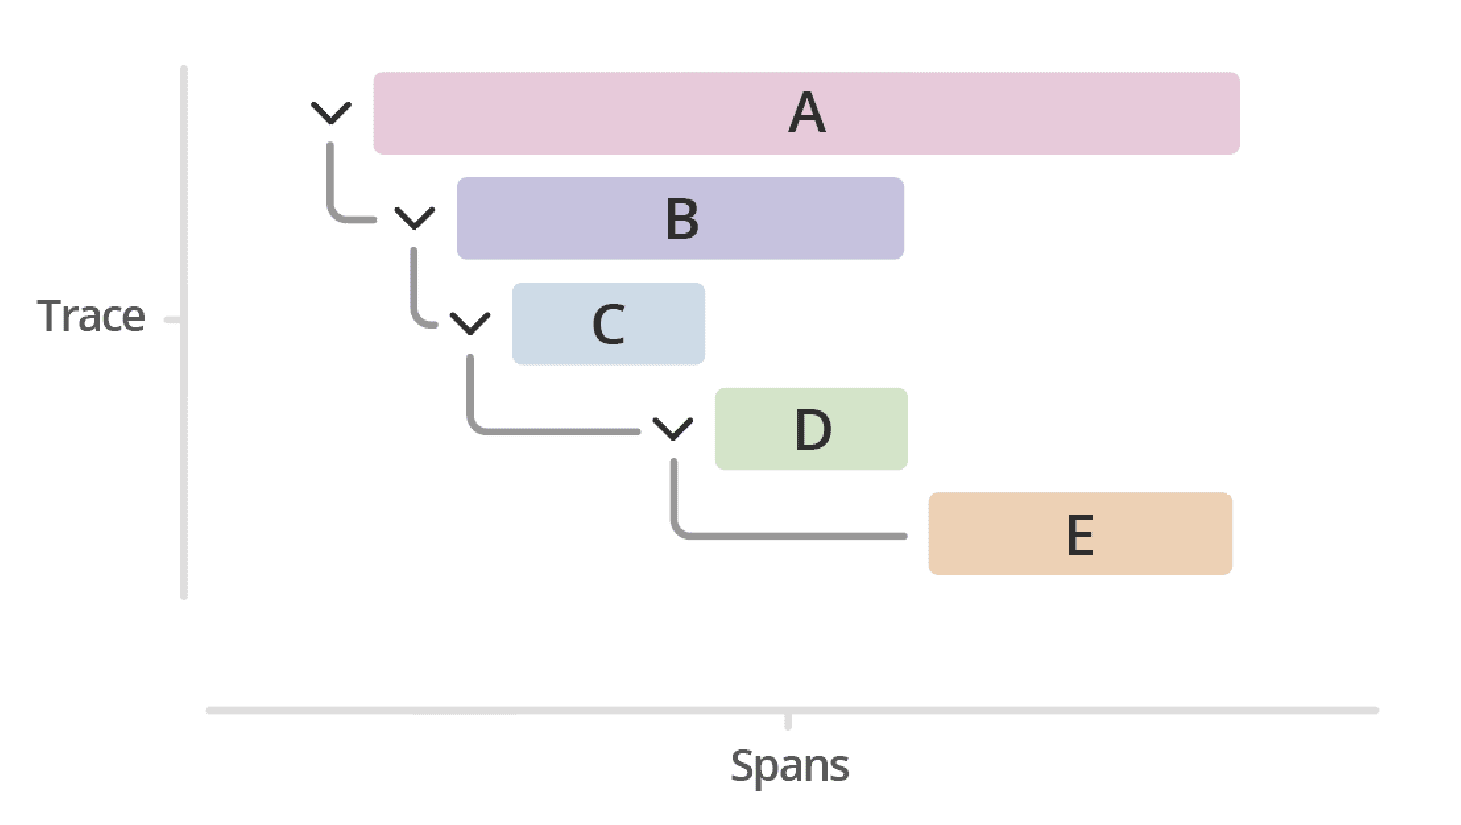
In each of the expanded window, we can see how every span id is related to one another, stacked over one another in root -> parent -> child relationship.
🎯 What happens under the hood
Under the hood we have OpenTracing implementation provided by Jaeger present in each of our application. These we can call as Jaeger Clients. We added this in our services via the io.opentracing.contrib dependency. They are responsible to intercept the service calls that happen from their host application and insert proper header information. These header information get passed over to the next subsequent calls, as part of context propagation.
🎯 Conclusion
I hope this post would have helped you in one way or the other. All the code changes that I did in this post are present at my GitHub repository.
If you have any suggestions for me, then please share that with me by commenting below.